By Dr. Richard Keen
At the end of each month, NCDC posts a “U.S. Climate at a Glance” summary on its website. The post features a color map of monthly mean temperature anomalies (departure from normal) for the entire U.S., based on an unspecified selection of stations.
It’s fun to find your home and pick out what the previous month was like there. I’ve done that for the past two months (June and July), and compared the analyzed departures to those actually measured at my NWS co-op station at Coal Creek Canyon, Colorado. For both months I found that the map departures calculated by NCDC for my location were about two degrees higher than the directly measured departure. The reports were posted on ICECAP and Watt’s Up With That, and last month I closed by saying..."I’ll keep checking this in future months, but I suspect the story will remain the same, with mystery adjustments inflating the temperature departures in one direction only.”
Now here is August’s report. I added the locations of Coal Creek Canyon and of the nearest NWS first-order station, Denver, to the map. On the map, both stations are within the +2F contour, with Denver approaching +4F. My best interpolation gives analyzed map departures of +2.5F at Coal Creek and +3.5F at Denver. Compare that to the actual departures (compared to the calculated normals for each station) of +1.2 and +2.1, respectively. Once again, the point departures in this part of Colorado are inflated by more than one degree.
Here is a list of the compared departures and Coal Creek and Denver for June, July, and August, 2010. The story is consistent - the NCDC analysis has the summer of 2010 running 3 degrees hotter than normal, while the observations have warm anomalies of less than half that. Those “mystery adjustments” raised Colorado’s summer temperature by 2 degrees above the direct measurements. Keep in mind that this two degree discrepancy is greater than the alleged “Climate Change” signal to date.
As I noted earlier, this is simply a spot check of two of NCDC’s 2000 grid points. But Denver is a major first-order station, and Coal Creek has been a stable station with no moves or urban influences for almost 30 years, and the instruments are meticulously maintained. Coal Creek is at 8950 feet elevation in the Colorado Rockies, a region predicted by all models referenced by the IPCC to have the greatest warming in the “lower 48” United States. According to NCDC analyses, this warming is occurring. According to actual observations, it is not.
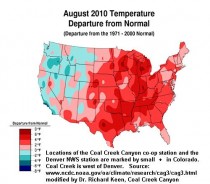
See enlarged here.
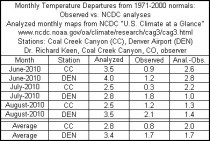
See enlarged here.
See PDF here.
------------------
Multidecadal Tendencies in ENSO and Global Temperatures Related to Multidecadal Oscillations
Energy & Environment, Volume 21, Numbers 5, pp. 437-460, September 2010, Joseph D’Aleo, Don Easterbrook
Abstract: Perlwitz etal (2009) used computer model suites to contend that the 2008 North American cooling was naturally induced as a result of the continent’s sensitivity to widespread cooling of the tropical (La Nina) and northeastern Pacific sea surface temperatures. But they concluded from their models that warming is likely to resume in coming years and that climate is unlikely to embark upon a prolonged period of cooling. We here show how their models fail to recognize the multidecadal behavior of sea surface temperatures in the Pacific Basin, which determines the frequency of El Ninos and La Ninas and suggests that the cooling will likely continue for several decades. We show how this will be reinforced with multidecadal shift in the Atlantic (and declining solar activity).
See publication here. More to come.
---------------
Radio/Internet Interviews
Brian Sussman, was this morning’s guest on the Tea Party Power Hour radio show. Brian discussed his new book Climategate: A Veteran Meteorologist Exposes The Global Warming Scam. Most intriguing was his discussion of how man-made global warming fits into the Marxist/Socialist/Communist agenda. To listen to the interview, please click on this link.
Steve Goreham, the author of Climatism: Science, Common Sense, and the 21st Century’s Hottest Topic, Recently joined us to discuss his new position as the head of the Climate Science Association of America. Goreham says his new association will try to take the politics out of climate science. To listen to the interview, please click on this link.
Is Cap and Trade dead in the United States? It may not matter as the Environmental Protection Agency prepares to regulate CO2 and other greenhouse gases as pollution. Shannon Goessling of the Southeastern Legal Foundation discusses her organization’s four lawsuits against the EPA here.
By Anthony Watts, Watts Up With That
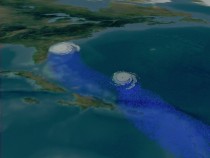
Two hurricanes approaching the coast of the United States, with the second hurricane slowed due to cooler waters caused by the track of the first
The Atlantic has been running warm lately, but that’s because there’s been little happening with Nature’s natural heat transporters. WUWT commenter SteveM pointed out something interesting in the latest SST image from NESDIS, but before we have a look at the animation I developed from that imagery, I thought we should have a look at the role that hurricanes play as heat engines.
First an animation from Goddard Space Flight Center:
And another, showing how the heat transport and surface cooling process operates.
From NASA SVS: As water vapor evaporates from the warm ocean surface, it is forced upward in the convective clouds that surround the eyewall and rainband regions of a storm. As the water vapor cools and condenses from a gas back to a liquid state, it releases latent heat. The release of latent heat warms the surrounding air, making it lighter and thus promoting more vigorous cloud development.
Now let’s watch this simple animation of the last two weeks of Sea Surface Temperatures and you’ll see the cool water tracks left by hurricanes Daniel and Earl:
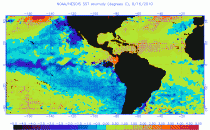
click here to enlarge and animate
You can see the cool tracks in the last frame. Note also the large and growing La Nina off the west coast of South America. It’s turning deep purple and on to black. Way cool. See post here.
“The climate and renewable energy con is losing its luster - prompting anguish and desperation” Icecap Note: To see how desparate they have become - they are lying through their teeth as this SPPI story by Tom Nelson shows. This is what happens when prophecies fail.
By Paul Driessen
It’s been a rough few weeks for the “eco-progressive” fringe.
Static jet streams induced near-record high temperatures in parts of the United States and Russia, but extreme cold pummeled Seattle, England and much of the Southern Hemisphere. Perhaps Al Gore, Michael Mann and Rajendra Pachauri can turn this hodgepodge into “catastrophic climate change,” but most folks understand it as Mother Nature and weather.
Polls and news accounts find more Americans, Europeans and other people becoming weary and skeptical of “manmade global warming disaster” claims, convinced that natural forces are the primary cause of recurrent climate change, and unwilling to accept soaring energy prices and reduced living standards in the name of stabilizing Earth’s unpredictable climate.
Few Americans place any value on EPA Administrator Lisa Jackson’s meaningless statement - that “climate change is happening and humans are contributing to it” - to justify the draconian regimes the agency is trying to impose. The issue is whether our emissions of plant-fertilizing carbon dioxide is causing catastrophic climate change, and there is no credible evidence of that.
The House-passed energy and climate bill remains moribund in the Senate. EPA is trying to regulate carbon dioxide in the absence of congressional action based on its assertion that automotive, power plant and factory CO2 emissions “endanger human health and welfare.” However, Texas refuses to knuckle- under, other states may likewise balk, and the next Congress could overturn the “endangerment” finding and bar EPA from rewriting the Clean Air Act and implementing its job-killing rules.
“Avatar” director James Cameron double-dared global warming disaster skeptics to debate him - then morphed into a chicken and cackled off when they accepted his increasingly ludicrous debate terms, calling his critics “swine” as he headed for the hills.
Having read too many Gore, Pachauri, Quinn and other Deep Ecology treatises, LunaBomber James Lee held Discovery Channel employees hostage and denounced the TV station for its support of “parasitic human infants,” before being shot by police. His website and actions underscore how demented some Earth Liberation and global warming fanatics have become.
As their economies have deteriorated, Germany, Italy, Spain and other countries have pulled the plug on unsustainable wind and solar subsidies, eliminating thousands of “green” jobs and putting hundreds of “clean energy” companies on the verge of bankruptcy.
Glen Beck’s “Restoring Honor” rally on the National Mall drew 300,000 people. Meanwhile, “CarnivOil” events in Wisconsin drew more yawns than people, as desperate Big Environment groups struggled to regain their momentum, by ranting about global warming, the Gulf oil spill, and “evil” oil companies.
Americans increasingly understand that even sending US carbon dioxide emissions back to 1870 levels, as congressional climate bills would do, will not reduce global atmospheric CO2 levels, because emissions from China, India and other nations will rapidly offset our painful reductions. Those countries have made it clear that they will not sacrifice improved living standards for assertions that we can stabilize global temperatures by keeping atmospheric CO2 levels below 0.035-0.045% (350-450 ppm).
As China’s former representative for climate negotiations recently said: “Developing nations...are not willing to combat climate change if the price is continued poverty.” The Chinese government has made “no concessions on the country’s right to develop.” Many problems can be solved only through development. “There are 600 million people in India without electricity. The country has to develop and meet that need. And if that increases emissions, I say, So what? The people have a right to a better life.”
Harvard University investigated and sanctioned Professor Marc Hauser for grossly exaggerating his primate research results. Yet, his actions pale by comparison to what Phil Jones, Michael Mann and other Climategate researchers engaged in. Hauser’s grants were a drop in the bucket compared to the climate cabal’s. And he was not advocating massive, expensive, punitive changes in our lives, liberties, and energy and economic systems. Will other institutions match Harvard’s demand for integrity?
The independent InterAcademy Council investigated the UN’s Intergovernmental Panel on Climate Change and issued a tough report that may help bring some integrity, transparency, accountability and sanity to what thus far has been mostly politics and activism masquerading as science. The IPCC, says the IAC, needs to replace data manipulation, suppression and bias with honest science; end conflicts of interest; incorporate contrary data and opinions; and back up headline-grabbing disaster claims with actual evidence (not just computer modesls or World Wildlife Fund press releases).
In other words, it must stop trying to prove manmade carbon dioxide is the sole or primary factor in climate change - and seek evidence-based answers to what drives climate change, what we might expect in the future, and how humans can better adapt to warmer, colder, wetter or drier futures.
The IAC and Hauser precedents should serve as a warning to climate colluders and manipulators. They are also increasing pressure on IPCC Chairman Pachauri to abdicate his throne, and be replaced by a respected climate expert who can bring a degree of integrity to this politicized organization.
HOWEVER, a belligerent Pachauri has told the Times of India he has “shed any inhibitions or feelings of cowardice. I believe this is now my opportunity to go out and do what I think is right. In the second term I may be a little more uncomfortable for people than I was in the first.”
Senator Harry Reid says he may still try to pass even a minimalist renewable energy bill in the Senate, and then use it to ram through an economy-disrupting climate bill during a lame duck session, if even by a single vote. That would make the United States the only country to enact draconian climate and energy rules in the midst of a recession - sending millions of jobs overseas, where energy prices and regulatory regimes are more hospitable and governments believe people have a right to better lives.
Aided by George Soros, leftist foundations and our own tax dollars (via EPA and other government agencies), radical greens are spending millions to lobby Congress. The Washington Post is giving free media to what it calls “some of the country’s most respected environmental groups” - helping them spin absurd street theater like CarnivOil into “educational” programs about saving Planet Earth (with vile oil executives bribing boxing referees and knocking out crab-costumed activists).
Teamster, teacher, auto and service employee unions are paying their own employees minimal wages and benefits, and sacking them for trying to unionize, columnist Deroy Murdock chronicles - while preparing to pump $50 million and legions of campaigners into ruling class Democrat reelection campaigns.
Meanwhile, Congress and EPA are pouring tens of millions of taxpayer dollars into Regional Greenhouse Gas Initiatives, to help RGGI director Jonathan Schrag persuade states to implement increasingly restrictive fossil fuel, emission and renewable energy mandates, regardless of what Congress does - and pay for his new $2.2-million loft in Manhattan.
The price of liberty is eternal vigilance. Today, on energy security issues, we unfortunately have less to worry about from external enemies, than from our own elitist politicians, bureaucrats and pressure groups.
In this critical election season, let us hope enough voters step up to defend our liberties, jobs, civil rights and children’s future. PDF
Paul Driessen is senior policy advisor for the Committee For A Constructive Tomorrow and Congress of Racial Equality, and author of Eco-Imperialism: Green power - Black death.
Are Heat Records Due To CO2? Ooops, No New Hot Record Temps In Last 30+ YearsNote: The CATO Institute is sponsoring the Green Swindle here. Well worth your time.
C3
Since the late 1980’s, global warming alarmists have been blaring ad nauseum that the world is suffering from ever higher temperatures, setting new hot temperature records, supposedly on a constant basis. Whenever warm weather arrives in the Northern Hemisphere, the warming hype onslaught from government paid climate scientists, MSM journalists and Hollywood celebrities escalates, as seemingly every new day, new week, new month, new quarter, new year and etc. is pronounced as the warmest evaaar! But is the world truly experiencing these highly publicized extreme, unprecedented hot temperatures?
The simple and honest answer is an emphatic ‘NO!’. In a previous post, the actual temperature data from weather stations around the world showed that “global” warming is actually regional warming, and, my goodness, also regional cooling. And if human CO2 emissions were really causing unprecedented, hot global weather (temperatures) then new hot temperature records for each continent should be happening - it ain’t happening, though, folks.
Looking at the map below (map source enlarged), the hottest and coldest temperatures ever recorded in modern times are presented for each continent.
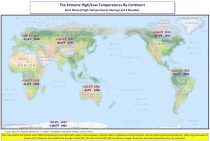
Look closely and realize what has actually not taken place. The last ‘hottest’ temperature record was set way back in 1977. Per the calendar, some 33 years later, no continent has exceeded their previous hot temperature record - and some of those records go all the way back to the early 20th century.
Hey...the next time you hear or read “unprecedented temperatures” from a ignorant leftist/liberal elite, don’t cut them any slack, go ahead and snicker (or start giggling) - it’s alright, you’re allowed to laugh at the stupendous ignorance exhibited by the Gore-zombies of the “progressive” left.
Remember, the myth that Earth “has a fever,” and the myth that human CO2 causes extreme temperatures, and the myth that unprecedented warming is global, are just that: myths, spread by individuals with a variety of crazy-leftist agendas.
For map (click here to enlarge). See table form below (source NOAA NCDC).
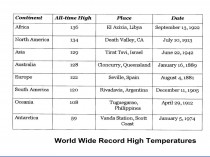
Enlarged here.
Did we say “extreme?” A few more Wikipedia extreme temperature/weather trivia points of relevance: (1) Fastest temperature rise recorded - 49F in 2 minutes in 1942; (2) Fastest temperature drop recorded - 47F in 15 minutes in 1911; (3) Most consecutive days above 100F recorded - 160 days from 1923 to 1924. And by the way, each of these most extreme weather events took place well before the influence of large human CO2 emissions.
Additional current temp charts here. Historical temp charts here. Excellent compilations!
See US state heat records (50 states - 12 months) below enlarged here (source Bruce Hall compiled from NCDC)
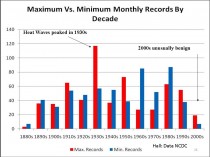
----------------------
CRU, NOAA AND NASA DATA MANIPULATION
By Joseph D’Aleo, CCM
Phil Jones admitted to the BBC that there was no statistically significant warming since 1995 and that it had cooled globally 0.12C from 2002 to 2009, not statistically significant but nonetheless a cooling even asw CO2 continued to rise. Temperatures popped this year as a strong though relatively brief El Nino came on. Even with El Nino, it was a brutally and in places all-time record cold winter in many land areas of the Northern Hemisphere last winter, but the Pacific thanks to the warm El Nino and the Atlantic thanks to a lack of tropical activity the prior summer and less wind and clouds with a weakened and suppressed subtropical high and high latitude blocking high pressure were both unseasonably warm. Land areas felt some of that warmth this summer though La Nina cooled the Pacific dramatically.
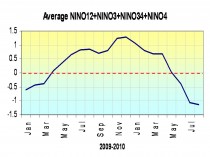
Average NINO region temperatures since January 2009 (enlarged here).
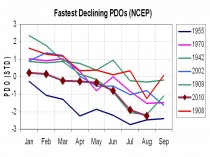
The PDO was slightly positive with the strong El Nino this January but is now strongly negative. This is a plot of all years in which the Multivariate ENSO Index (MEI) declined more than 2 STD from January to August. Enlarged here. This should induce a global cooling in upcoming months. This will be aided by a cooling of the Atlantic by the tropical activity which is enhanced by La Nina and acts to extract excess tropical heat from the tropical oceans and reduce warm anomalies further north through mixing.
Nevertheless the manipulation of the global data bases in all the data sets over the last century has elevated the chances that each month will rank among the warmest. All three data centers have cooled the past and warmed the more recent years through their data manipulation. Here are NASA plots of 1980 and 2010.
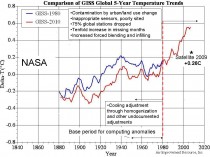
Enlarged here.
Here is the CRU plot just since 2001.
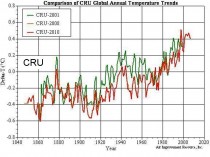
Enlarged here.
This is the change in the NOAA USHCN in 2007 from the original version in 1990.
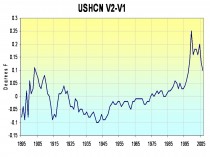
Enlarged here. More on NOAA coming soon.
All three data centers have cooled the past and allowed data issues produce increasingly warm biases in the last few decades to ensure the data is more in line with their models (but even with the changes, it is falling far short). They have succeeded in ensuring they can claim ranking warm months and years but can’t yet match their models.
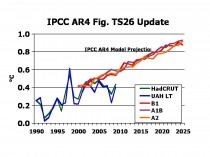
Enlarged here. Source John Christy UAH annual vs IPCC AR4 projected scenarios for temperatures.
Wait until the ocean cooling and long solar cycle 23 and wimpy cycle 24 evolves. See story here.
By Dr. Tim Ball, Canada Free Press
It’s time to stop the lies, deceptions, denials and fantasy that is the world of political climate science known as the Intergovernmental Panel on Climate Change (IPCC). Official climate science recently offered more insults, comparable to the whitewash investigations of Michael Mann, and the Climatic Research Unit (CRU) gang, with its latest ‘investigation’ of the IPCC.
They think a simple mea culpa will do the job and allow them to continue their corrupt and corrupting ways. It won’t and it can’t. Not even the full mea maxima culpa will solve the problem.
The most recent whitewash
The most recent whitewash began with UN Secretary General Ban ki Moon ordering a supposedly independent investigation. The Inter Academy Council (IAC), which combines 15 Science Academies, whatever that means, were assigned to produce a very limited report. “The review by the IAC will not involve any in-depth analysis of the report produced by the IPCC, or of any “vast amounts of data”. “
It’s no surprise they prepared a very shallow report that identifies some errors and makes recommendations for the ongoing IPCC, but it is grossly inadequate. Why didn’t they talk to people who have raised questions about the process? Why didn’t they review the extensive literature on problems with the IPCC and the entire process? Why didn’t they recommend the removal from office of Rajendra Pachauri, Chairman of the IPCC? His activities are well documented and clearly show his integrity is completely compromised. The scientist whose false report on retreat of Himalayan glaciers was used by the IPCC worked for TERI of which Pachauri is the chairman. Why do they avoid the connections between CRU and IPCC?
The answer is given in the list of members of the IAC Board. It includes Ralph Cicerone, which though he may not have been involved in the Report, gives a flavor of the bias of the group. He has been very active in defense of the IPCC positions and in attacking those who dare question. Here is what he said about IPCC reports, “This is the most comprehensive report ever on climate change,” said atmospheric scientist Ralph J. Cicerone, the president of the academy. They outline “why the U.S. should act now to reduce greenhouse gas emissions and why we should have a national strategy to adapt to the inevitable.”
It is underlined by the fact the last IAC report was on alternate energy, the unworkable but favorite solution of IPCC proponents.
Inter Academy Council demonstrate their lack of understanding
The IAC clearly has no idea of the history of the political hijacking of climate science that used the UN, the WMO and culminated in the IPCC. They acknowledge some of the minor errors made, such as the article on Himalayas glaciers that they used to claim ice was melting and faster than any logical research allowed. They dismiss these items as misguided and fail to put them in the entire context of corruption that is the IPCC. They fail to make the connection between the leaked emails from the Climatic Research Unit (CRU) people and the IPCC. They demonstrate their lack of understanding by advising the IPCC not to make predictions unless they had solid evidence. The United Nations climate panel should make predictions only when it has solid evidence and should avoid policy advocacy, scientists said in a report yesterday that called for thorough reform of the body.
The problem is the IPCC doesn’t make predictions. They stopped after their dismal failures in the first two Reports. They cleverly and deliberately called them projections from a range of scenarios. Of course, the mainstream media choose to report the worse case scenario with regard to temperature increase. All these scenarios are based on false assumptions and evidence that was given far too much credence. As Chairman of the IAC group, Princeton professor Harold Shapiro said one of the Reports, “contains many statements that were assigned high confidence but for which there is little evidence.”
It wasn’t just one of the Reports. Shapiro, and likely his group, fails to understand each Report builds on the previous one purportedly adding new material. In fact, the record shows they eliminated awkward material such as the graph showing the Mediaeval Warm Period (MWP), or ignored well-documented research such as the Svensmark theory on the relationship between sunspots and global temperature.
After the IAC Report was released, Ban Ki Moon confirmed the incestuous nature of the investigation and gave an example of the gamesmanship he practices so well. He and Achem Steiner, head of the United Nations Environmental Program (UNEP), said the report had done nothing to undermine the solid science in the IPCC Report. Of course not, they deliberately worked to that goal.
Nothing will change soon. Too many political, bureaucratic and academic careers are dependent on perpetuating the IPCC. Too many green industries have developed to take advantage of the billions governments have poured into alternate energies and other unworkable projects. Too many lobby groups are dependent on government funding, and use the IPCC message to shake funds out of a deceived and worried public.
In a recent article I recommended scrapping government weather agencies.
Maurice Strong used the UN to set up the IPCC and pursue his political goals
This is important because it was through them and their membership in the World Meteorological Organization (WMO) that IPCC was created, funded and perverted. Maurice Strong used the UN to set up the IPCC and pursue his political goals. Its entire purpose was political and not scientific at all. The IAC were chosen not to realize this and couldn’t know because they didn’t do their research. To their credit they acknowledge the political leanings when they report that the IPCC is “at the interface between science and politics”, but it appears more a comment to quiet complaints than expose the obvious. They say the political actions of some senior IPCC members are harmful. “Straying into advocacy can only hurt IPCC’s credibility”. The reality is it has none and should be disbanded immediately along with the government weather agencies used for its creation.
Tim Ball interviews on Climategate here and here. CFP post is here.
Dr. Tim Ball is a renowned environmental consultant and former climatology professor at the University of Winnipeg
By Ray Lilley, AP
WELLINGTON, New Zealand (AP) - A powerful 7.1-magnitude earthquake struck much of New Zealand’s South Island early Saturday and caused widespread damage, but there were just two reports of serious injuries. Looters broke into some damaged shops in Christchurch, police said.
The quake, which hit 19 miles (30 kilometers) west of the southern city of Christchurch according to the state geological agency GNS Science, shook a wide area, with some residents saying buildings had collapsed and power was severed. No tsunami alert was issued.
GNS Science initially reported the quake as magnitude 7.4, but later downgraded it after re-examining quake records. The U.S. Geological Survey, in America, measured the quake at 7.0.
Christchurch Mayor Bob Parker declared a state of emergency four hours after the quake rocked the region, warning people that continuing aftershocks could cause masonry to fall from damaged buildings.
The emergency meant parts of the city would be closed off and some buildings closed as unsafe, he said. Minister of Civil Defense John Carter said a state of civil emergency was declared as the quake was “a significant disaster,” and army troops were on standby to assist.
Parker said the “sharp, vicious earthquake has caused significant damage in parts of the city ... with walls collapsed that have fallen into the streets.” Chimneys and walls had fallen from older buildings, with roads blocked, traffic lights out and power, gas and water supplies disrupted, he said.
“The fronts of at least five buildings in the central city have collapsed and rubble is strewn across many roads,” Christchurch resident Angela Morgan told The Associated Press. “Roads have subsided where water mains have broken and a lot of people evacuated in panic from seaside areas for fear of a tsunami,” she said, adding that “there is quite significant damage, really, with reports that some people were trapped in damaged houses.”
Christchurch fire service spokesman Mike Bowden said a number of people had been trapped in buildings by fallen chimneys and blocked entrances, but there were no reports of people pinned under rubble. Rescue teams were out checking premises.
Christchurch Hospital said it had treated two men with serious injuries and a number of people with minor injuries. One man was hit by a falling chimney and was in serious condition in intensive care, while a second was badly cut by glass, hospital spokeswoman Michele Hider said.
Christchurch police reported road damage in parts of the city of 400,000 people, with a series of sharp aftershocks rocking the area. Police officers cordoned off some streets where rubble was strewn about. Video showed parked cars crushed by heaps of fallen bricks, and buckled roads.
“There is considerable damage in the central city and we’ve also had reports of looting, just shop windows broken and easy picking of displays,” Police Inspector Mike Coleman told New Zealand’s National Radio. Police Inspector Alf Stewart told the radio that some people had been arrested for looting. “We have some reports of people smashing (storefront) windows and trying to grab some property that is not theirs ... we’ve got police on the streets and we’re dealing with that,” he said.
Suburban dweller Mark O’Connell said his house was full of smashed glass, food tossed from shelves, with sets of drawers, TVs and computers tipped over.
“She was a beauty, we were thrown from wall to wall as we tried to escape down the stairs to get to safety,” he told the AP. “It was pitch black (with the power cut) and we walked through smashed glass everywhere on the floor.”
The quake hit at 4:35 a.m. (1635 GMT) shaking thousands of residents awake, New Zealand’s National Radio reported. Some 12 aftershocks have rocked the region since, ranging from 5.3 to 3.9 in magnitude, GNS Science reported on its web site.
Prime Minister John Key, Carter and Energy Minister Gerry Brownlee were to fly to Christchurch to inspect damage and review the situation, officials said.
Civil defense agency spokesman David Millar said at least six bridges in the region had been badly damaged, while the historic Empire hotel in the port town of Lyttelton was “very unstable” and in danger of collapse. Roads, shops and other buildings in rural towns around Christchurch had also suffered damage, with some shop fronts knocked down in the jolt.
Inspector Coleman said residents of the city’s low-lying eastern suburbs had been advised to be ready to evacuate their properties, after power, gas, sewerage and water systems were cut by the quake. Resident Colleen Simpson said panicked residents ran into the street in their pajamas. Some buildings had collapsed, there was no power, and the mobile telephone network had failed.
“Oh my God. There is a row of shops completely demolished right in front of me,” Simpson told the Stuff news Web site.
Kiwirail rail transport group spokesman Kevin Ramshaw said 13 mostly freight trains had been halted on South Island lines, with some damage already confirmed to rail lines north of Christchurch.
Christchurch International Airport was closed after the quake as a precaution, as experts checked runways and terminal buildings, a spokesman said.
The Pacific Tsunami Warning Center said “no destructive widespread tsunami threat existed, based on historical earthquake and tsunami data.” New Zealand sits above an area of the Earth’s crust where two tectonic plates collide. The country records more than 14,000 earthquakes a year - but only about 150 are felt by residents. Fewer than 10 a year do any damage.
New Zealand’s last major earthquake was a magnitude 7.8 in South Island’s Fiordland region on July 16, 2009 - a tremblor which moved the southern tip of the country 12 inches (30 centimeters) closer to Australia, seismologist Ken Gledhill said at the time. Gledhill, director of GNS Science’s “GeoNet” national earthquake monitoring project, said the island’s geographic shift showed the immensity of the forces involved. Read more and see videos here.

The only lower price than today’s closing price on a ton of carbon is ZERO.
Perhaps reacting to the news yesterday about the IPCC getting taken to the woodshed, the growing number of stories in the MSM about the IPCC failure, and the recent layoffs at CCX, carbon trading has once again been devalued by the market. Amazingly, it lost 50% of it’s value for 2006, 2007, and 2008 “carbon instruments” today. Here’s the CCX front page graph at closing today:
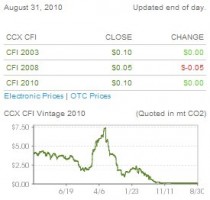
Enlarged here.
The CCX end of day table really says it all, 50% off, from a dime to a nickel in a day:

CCX end of day, August 31, 2010
It must have really killed the person to have to put in a nickel for the closing value today.
Charcoal briquettes and coal have more value than a ton of CCX carbon instruments these days.
Unless CCX starts making adjustments in single cents, the next downward adjustment is zero. The latest CCX advisory says they will be closed for labor day, and will reopen for trading September 7th. One wonders. See post here.
See Alan Caruba’s Carbon Dioxide Riches Disappear here.
------------
Retro back to early last year for this story in the Canada Free Press:
Obama’s involvement in Chicago Climate Exchange -the rest of the story
By Judi McLeod Wednesday, March 25, 2009
Good news to know that the truth will always out - even when you’re Barack Obama.
“Obama Years Ago Helped Fund Carbon Program He Is Now Pushing Through Congress’ is a FOXNews story by Ed Barnes. In short, ‘While on the board of a Chicago-based charity, Barack Obama helped fund a carbon trading exchange that will likely play a critical role in the cap-and-trade carbon reduction program he is now trying to push through Congress as president.”
The charity was the Joyce Foundation on whose board of directors Obama served and which gave nearly $1.1 million in two separate grants that were “instrumental in developing and launching the privately-owned Chicago Climate Exchange, which now calls itself “North America’s only cap and trade system for all six greenhouse gases, with global affiliates and projects worldwide.”
And that’s only the beginning of this tawdry tale, Mr. Barnes.
The “privately-owned” Chicago Climate Exchange is heavily influenced by Obama cohorts Al Gore and Maurice Strong. For years now Strong and Gore have been cashing in on that lucrative cottage industry known as man-made global warming. Strong is on the board of directors of the Chicago Climate Exchange, Wikipedia-described as “the world’s first and North America’s only legally binding greenhouse gas emission registry reduction system for emission sources and offset projects in North America and Brazil.”
Gore, self-proclaimed Patron Saint of the Environment, buys his carbon off-sets from himself - the Generation Investment Management LLP, “an independent, private, owner-managed partnership established in 2004 with offices in London and Washington, D.C., of which he is both chairman and founding partner. The Generation Investment Management business has considerable influence over the major carbon credit trading firms that currently exist, including the Chicago Climate Exchange.
Strong, the silent partner, is a man whose name often draws a blank on the Washington cocktail circuit. Even though a former Secretary General of the 1992 United Nations Conference on Environment and Development (the much hyped Rio Earth Summit) and Under-Secretary General of the United Nations in the days of an Oil-for-Food beleaguered Kofi Annan, the Canadian born Strong is little known in the United States. That’s because he spends most of his time in China where he he has been working to make the communist country the world’s next superpower. The nondescript Strong, nonetheless is the big cheese in the underworld of climate change and is one of the main architects of the failing Kyoto Protocol.
If we follow the time line on where Obama was during the funding of the Chicago Climate Exchange, he was still a lecturer at the University of Chicago Law School teaching constitutional law, with his law license becoming inactive a year later in 2002. It may be interesting to note that the Chicago Climate Exchange in spite of its hype, is a veritable rat’s nest of cronyism. The largest shareholder in the Exchange is Goldman Sachs. Chicago Mayor Richard M. Daley is its honorary chairman, The Joyce Foundation, which funded the Exchange also funded money for John Ayers’ Chicago School Initiatives. John is the brother of William Ayers.
The same Chicago Climate Exchange promoting public rip-off was funded by Obama before he was POTUS. Even as man-made global warming is being exposed as a money-generating hoax, Obama is working feverishly to push the controversial cap-and-trade carbon reduction scheme through Congress.
Obama was never the character he created for himself in the fairy-tale version in “Dreams of My Father”. He’s the agent of Change and Hope for cohorts making money down at the Chicago Climate Exchange. The Barbarians are pushing at the gate of the Global Warming fraud, and to borrow a line from children playing Hide and Seek, Here they come, ready or not! See post here. See list of CCX corporate members here.
Board members have included Maurice Strong, Mayor Richard Daley, Valerie Jarrett, Ed Begley Jr..
Posted by Kooten
Recently, Canada’s Global National News (Friday, July 16, 2010) carried a story indicating that 2010 was the hottest year on record. A follow-up article in Victoria’s Times-Colonist newspaper (July 18, 2010, p.A12) made a similar claim. The claims remind me of the children’s story “The Emperor has no Clothes,” about a tailor who managed to convince the emperor and his entourage that they were incapable of seeing the wonderful tunic he was sewing. When the emperor paraded in his new suit, a child exposed the scam by asking why the emperor had no clothes on.
Thus it is with climate. Although Victorians experienced a mild winter and spring, the last few months have been colder than usual. The Canadian prairies experienced a miserable winter and things were not much better elsewhere in North America and Europe. However, a few weeks of warm weather in Europe and eastern Canada, and it becomes easy to sell the idea that temperatures are the highest they have ever been and that 2010 is on course for become the warmest year ever! Is this so?
NASA temperature data underlie these stories. Consider the ten warmest years as reported in Table 1. The data in the table are here , but viewed on three different dates as indicated. Since data collected in August 2007 are available only through 2006, 2007 is not included in the earliest ranking given in Table 1.
Table 1: Ten Warmest Years based on Average Contiguous 48 U.S. Surface Air Temperature Anomalies, 1880 through 2006
Date when data was retrieved from NASA website
8/20/2007 5/27/2009 4/26/2010
1934 1934 1998
1998 1998 2006
1921 1921 1934
2006 2006 1921
1931 1931 1999
1999 1999 1931
1953 1953 1990
1990 1990 2001
1938 1938 2005
1939 1954 2007
NASA scientists have adjusted the data in ways that make more recent years appear warmer - scientists have dropped weather stations and/or used a different method for ‘adjusting’ the data. Thus, the number of years from the past two decades that appear in the top twenty warm years (only the top ten are shown in Table 1) has increased from 7 to 8 and finally to 11. In the May 2009 listing, 2007 is the 14th warmest year in the historical record, but it has moved up to tenth by the April 2010 listing. While it may be true that the latest adjustments are scientifically better than earlier adjustments, it seems odd that the most recent years now show up as among the warmest in the temperature record, contrary to evidence from satellite data and reconstructions by the Climate Research Unit at East Anglia University in the UK - reconstructions that use the same underlying data as NASA.
Other evidence fails to support the NASA story. Using the unadjusted U.S. weather station data, 22 out of 50 states recorded their highest temperature during the 1930s. Likewise, a 2006 study in the Journal of Geophysical Research found that 1941 was the warmest year experienced in Greenland between 1784 and 2005, while the 1930s and 1940s were the warmest decades; 1863 was the coldest year while the coldest decade was the 1810s (although it corresponded to two volcanic eruptions in 1809 and 1815). A 2010 study in Climatic Change reconstructs winter and spring temperatures for Stockholm going back 500 years. The warmest and coldest years are reported in Table 2. Notice that 1863 was the warmest winter/spring, while 1569 was the coldest.
Table 2: Ten coldest/warmest January-April Seasons in the Past 500 Years, Stockholm, Sweden, Temperature Anomalies in oC from 1961-90 Average
Rank Year Rank Year
Ten coldest Ten warmest
1 1569 1 1863
2 1573 2 1990
3 1557 3 1743
4 1595 4 1525
5 1572 5 1989
6 1942 6 1605
7 1614 7 1822
8 1600 8 1790
9 1574 9 1762
10 1940 10 2008
ICECAP NOTE: See (below, enlarged here) how NASA temperatures have been significantly manipulated since 1980. The changes produced a cooling of the warm blip in the 1930s and 1940s and a warming post 1980 for numerous reasons.

By Jeremy A. Kaplan
Acknowledging flaws in its reports and growing public skepticism toward the theory of manmade global warming, the United Nations hired an independent review panel in March to audit its climate-science arm. The group found plenty of problems.
The InterAcademy Council, an independent group of scientists representing agencies from around the world, presented the findings of its five-month investigation Monday morning at the United Nations. The group took issue with the structure, methods and leadership of the U.N.’s Intergovernmental Panel on Climate Change (IPCC)—the group responsible for a 2007 report that erroneously forecast the imminent melting of Himalayan glaciers, the rate of melt of polar ice caps and dwindling Amazon rainforests.
“The IPCC has raised public awareness of climate change, and driven policymakers,” said Harold Shapiro, chair of the IAC Committee to Review IPCC and former president of Princeton University. But the controversies that have erupted, and revelations of errors, have put the group under the microscope. “We recommend some significant reforms,” he told the U.N.
“The IPCC has yet to review the IAC’s findings, so I am not able to comment on its findings,” said longstanding chair Rajendra Pachauri in a press conference following the presentation. But he did note that none of the seven reviews of the IPCC to date had found flaws in the U.N. group.
“The scientific community agrees that climate change is real,” Pachauri said.
Despite his confidence, the science underlying climate change has come under great scrutiny. Yet the IAC did not spend its time analyzing the accuracy of climate models and climate science.
“We did not redo the science,” said Shapiro. Instead, the IAC focused its attention on the procedures and methodologies of the IPCC, suggesting many areas for improvement.
The rate of melt of the Himalayan glaciers was one touchstone among skeptics of manmade global warming that the group addressed. Shapiro explained that many reviewers noted the lack of substance behind the claim, but their criticism didn’t make it into the final report.
It appears that editors “didn’t follow through carefully enough on what review editors commented,” said Shapiro.
The IAC faulted the IPCC for making this type of mistake in several places, noting that the report includes several statements that are assigned high levels of confidence, Shapiro told the U.N., despite a lack of sufficient evidence behind them.
“We found in the summary for policymakers that there were two kinds of errors that came up—one is the kind where they place high confidence in something where there is very little evidence. The other is the kind where you make a statement...with no substantive value, in our judgment.”
Revising and tightening up the complex and lengthy review policy would help to address these issues.
Noted climate skeptic Don Easterbrook, an emeritus professor of geology at Western Washington University, agreed that this type of issue was a problem. “The IPCC report is filled with statements of ‘90% certainty’ without even saying 90% of what or providing any basis for such statements. Yet those pronouncements of certainty were used over and over as though that had been scientifically proven somehow,” he told FoxNews.com.
The IAC called for the IPCC to completely revise top leadership, including limiting the duration of people in top positions and “electing a small executive committee to act on its behalf,” one that even included non-scientists. This would lend it credibility, Shapiro said.
Questions have arisen about conflicts of interest among top leadership at the IPCC, notably chair Pachauri, who sits on the boards of numerous other climate-related groups. Shapiro stressed that this important issue was one the group did not investigate—“we didn’t consider it our charge to investigate that issue,” he replied.
Easterbrook thinks this suggestion may not go far enough.
“The IAC report makes several recommendations to fortify IPCC’s management structure, including establishing an executive committee to act on the panel’s behalf and ensure that an ongoing decision-making capability is maintained. This would be a step in the right direction, but if such an executive committee is made up of the same old political cronies, nothing will change,” he told FoxNews.com.
The IAC took issue with the IPCC’s use of so-called gray literature as well, papers from unpublished or non-peer-reviewed sources. Such material is explicitly against policy, yet authors of the IPCC’s reports do not follow the guidelines for evaluating such sources, explained the IAC.
The group recommended that these guidelines be made more specific—including adding guidelines on what types of literature are unacceptable—and strictly enforced to ensure that unpublished and non-peer-reviewed literature is appropriately flagged.
The Union of Concerned Scientists, a nonprofit group that supports the concept of manmade global warming, agreed with the IAC’s report, calling it “a great opportunity to strengthen” the group, but not a wholesale call to rework the agency.
“It’s a substantial tune up, but not a replacement with a new vehicle,” Peter Frumhoff, director of science and policy for the UCS, told FoxNews.com. “All the recommendations I’ve seen are really spot on. We’ll see what happens when the IPCC meets in October.”
The IAC’s assessment will be used at the Oct. 5 meeting that marks the beginning of the IPCC’s effort to put out the next report.
“The IPCC has been successful overall, but fundamental changes are needed,” Shapiro said.
See story here.
By Dr. Tim Ball Canada Free Press
Recently Kerry Emanuel said, “Why would anybody ask weather forecasters about their opinion on climate? I think it is because there is a hope that I don’t think is justified that ordinary people will confuse weather forecasters with climate scientists.”

Emanuel is a professor of meteorology at MIT with a specialization in atmospheric convection and hurricanes. He is a meteorologist not a climatologist and many weather forecasters are meteorologists. Indeed, his specialty is even more narrow than that required by weather forecasters.
Dr. Emanuel served on the deliberately biased Lord Oxburgh committee investigating Climategate. He argued that hurricane activity would increase with global warming, but is reportedly rethinking that position. His comments were part of a 10-minute documentary about the apparently different views of media meteorologists and climatologists. He also said, “Weather forecasters are in a unique position. I mean if they actually did study the problem, if they actually took the time to really understand it rather than just go to the blogosphere to get their favourite views and rebroadcast them, then I think they could do a lot of good in the world and I think there are some who are doing that to be fair.” Dr. Emanuel served on the deliberately biased Lord Oxburgh committee investigating Climategate, the leaked emails from the Climatic Research Unit (CRU). He’s a co-author with Michael Mann and dismissed the leaks as “the well-funded “public relations campaign” to drown out or distort the message of climate science, which he links to “interests where billions, even trillions are at stake “This “machine has been highly successful in branding climate scientists as a bunch of sandal-wearing, fruit-juice drinking leftist radicals engaged in a massive conspiracy to return us to agrarian society. “Emanuel’s comments are breathtaking in their naivete, arrogance and ignorance. They’re made without challenge by mainstream media because they don’t know what is wrong with them.
Meteorology Before Climatology
The confusion is between, meteorology, weather and climate and is largely the result of how they evolved historically. Aristotle wrote a book titled Meteorology that was concerned with processes and phenomenon of the atmosphere. The intent was to understand mechanisms for weather forecasting. This declined until the 19th century when development of instruments such as the thermometer and barometer combined with a desire to measure and understand the constituents of the atmosphere. An early example was discovery of oxygen independently by Scheele in 1773 and Priestley in 1774. Physics became more dominant so that by the beginning of the 20th century it dominated meteorology. In Canada for example, to become a government weather forecaster a Masters degree in Physics was required. After which, a brief in–house course taught weather forecasting. There was virtually no climate instruction. The pattern was similar around the world.
Even today few people know about climatology or the difference between weather and climate. When I began public speaking I started talks with a definition of climatology. First I told how, when speaking about the weather to a class studying the Fur Trade, the teacher introduced me as a climatologist. Immediately a hand went up and the young student wanted to know how many mountains I’d climbed. People laughed because it was obviously wrong, but most didn’t know the correct answer. Mark Twain knew the difference when he said climate is what you expect, weather is what you get, but for most, the weather, meteorology as physics of the atmosphere, had taken over.
Climate is derived from the Greek word klimat that refers to the angle of the Sun or inclination. They understood how this created three different climate regions, cold, temperate and hot. These were average conditions because climate is the average weather over time or in a region. The angle of the sun is a major factor in determining the climate, but it is only one of a myriad of factors. When Sir Francis Drake set out for the west coast of North America he expected to find a climate similar to that in England because it was equal in latitude so the sun’s angle was similar. They didn’t know how the ocean currents transported vast amounts of heat toward the Pole to alter the pattern of climate in Western Europe.
There was a brief flurry of interest in climate at the end of the 19th century as the concept of climatic determinism was embedded in environmental determinism. It held that people were a product of the climatic region in which they were born and lived. It reached an extreme with Ellsworth Huntington and publications like Civilization and Climate in 1915. His work evolved from Friedrich Ratzel’s Anthropogeographie published in two volumes published (1882 and 1891). All this provided an intellectual framework for white supremacy in Hitler’s Mein Kampf.
Ironically, during the war Hubert Lamb working as a meteorologist and gradually became aware of changing climate in historic times. He wanted to improve the forecasts and spent time studying historical records and by 1972 had established the Climatic Research Unit (CRU) at East Anglia. He wrote, “When the Climatic Research Unit was founded, it was clear that the first need was to establish the facts of the past record of the natural climate in times before any side effects of human activities could well be important.” Only one other climate research establishment in the world at the time was Reid Bryson’s Center for Climatic Research at Madison, Wisconsin. CRU had insufficient funds because nobody was interested in climate at that time.
A major problem was the growth of specialization in academia, but climate is a generalist topic. It’s the average weather that is the product of a multitude of factors from cosmic radiation from deep space, to geothermal heat from within the Earth, and everything in between. Meteorology is a subset of the weather like oceanography and each of these have subsets. One of them involves the specialized tropical convection and hurricane research of Emanuel. He only studies one piece of a very complex puzzle. It explains why he incorrectly predicted increased hurricane activity due to global warming. As Henri Poincare said, “Science is built of facts the way a house is built of bricks; but an accumulation of facts is no more science than a pile of bricks is a house.” Someone also said about economists that. “They try to predict the tide by measuring one wave.” Climate science does the same thing and Emanuel sides with the argument that the one wave is CO2.
See post here.
--------------
Interview on Climate Change Issues
by Kim Greenhouse on August 23, 2010
Joe D’Aleo joins us to discuss Surface Temperatures: A Policy Driven Deception, a new report that he co-wrote with Anthony Watts. Joe separates fact from fiction about CO2 and outlines its benefits and functions. Join us and learn how the EPA declared CO2 a toxin based on an analysis by a team with an agenda to control carbon and how we use energy and energy sources. Listen to this one hour interview here.
UPDATE: In a program “Green Swindle” devoted to exposing the roots of the global warming scandal, Sean Hannity featured many climate skeptics on his Fox News program - part 1 here, part 2 here. 500,000 to some estimate as many as 2 million descended on Washington, D.C. for the 8-28-10 Restoring Honor Rally, CSPAN televised the event.

The event was streamed live via Facebook. It was a very uplifting event. Beck like Hannity have shown how the global warming issue is a fraud and how it evolved and who are involved. There was no politics at the rally though. It was all restoring traditional American values and pride in our heritage.
------------
Ice Sheet Loss Cut in Half
By Doug Hoffman
Much concern has been raised by climate scientists regarding ice loss from the world’s two remaining continental ice sheets. Rapid loss of ice-mass from the glaciers of Greenland and Antarctica are cited as proof positive of global warming’s onslaught. The latest measurements involve the use of satellite gravimetry, estimating the mass of terrain beneath by detecting slight changes in gravity as a satellite passes overhead. But gravity measurements of ice-mass loss are complicated by glacial isostatic adjustments - compensation for the rise or fall of the underlying crustal material. A new article in Nature Geoscience describes an innovative approach employed to derive ice-mass changes from GRACE data. The report suggests significantly smaller overall ice-mass losses than previous estimates.
The storage of water or ice on land - the presence of large bodies of water or glacial ice sheets - affect the Earth’s gravitational field. This effect is detected by the NASA Gravity Recovery and Climate Experiment (GRACE) satellites. Twin satellites were launched in March 2002, to make detailed measurements of Earth’s gravity field. Since then, GRACE has been used to study tectonic features, estimate ground water volumes and calculate the amount of ice contained in the Greenland and Antarctica ice sheets. However, other factors can contribute to the GRACE measurements than just the volume of ice in an ice sheet. These factors include the response of Earth’s crust (the lithosphere) to past changes in ice load.
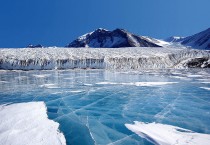
Antarctica was found to be rising, but not as fast as previously thought.
As the weight of covering ice varies, the underlying surface rock can be pushed down or rise up, buoyed by the magma that the crust floats on. This would obviously impact efforts to measure the height of terrain, including glaciers. Compensating for the rise and fall of bedrock is termed glacial isostatic adjustment, and it can have a significant impact on estimated ice-mass losses. Changes in the spatial distribution of the atmospheric and oceanic masses can also enter into the picture. Correctly assessing these different factors is the key to accurately calculating ice-sheet mass balance. Xiaoping Wu and colleagues have proposed a new method for untangling these factors from GRACE measurements. In a News and Views commentary on the work by Wu et al., David H. Bromwich and Julien P. Nicolas sum up the problem:
The atmospheric and oceanic contributions are commonly derived from global reanalyses or other global climate models that assimilate observations. However, the contribution from glacial isostatic adjustment is more difficult to evaluate because the Earth’s mantle is viscoelastic and therefore responds to changes in surface loading with a long delay. Indeed, the variations of the mass and extent of the ice sheets since the Last Glacial Maximum, about 20,000 years ago, continue to affect present-day changes in bedrock elevation. Assessments of the glacial isostatic adjustment typically rely on deglaciation models - which simulate the evolution of the ice sheets since the Last Glacial Maximum - together with assumptions about the viscosity profile of the mantle. Much is still unknown regarding the history of the ice sheets, and even less is known about the behaviour of the mantle in response to loading and unloading.
The method used by Wu et al., in “Simultaneous estimation of global present-day water transport and glacial isostatic adjustment,” estimates ice-mass changes and glacial isostatic adjustment simultaneously, instead of estimating the latter separately from deglaciation models as had been done before. The problem is expressed in terms of a single matrix equation, with the observed surface-height changes decomposed into their different contributions. The equation is then solved for ice-mass changes using matrix inversion. While the glacial isostatic adjustment that results is not directly generated by deglaciation models, the inversion method still requires a first-guess estimate to begin the calculations.
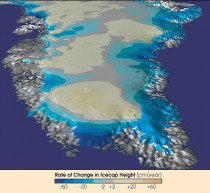
Ice loss in Greenland has been significantly overestimated.
In describing their work, Wu et al. state: “Here we combine gravity measurements and geodetic data of surface movement with a data-assimilating model of ocean bottom pressure to simultaneously estimate present-day water transport and glacial isostatic adjustment. We determine their separate contributions to movements in the geocentre, which occur in response to changes in the Earth’s mass distribution, with uncertainties below 0.1 mm yr−1.” They further describe their methodology as follows:
From April 2002 to December 2008, linear trends are derived from GRACE gravity data with empirically calibrated full covariance matrices, and from the Jet Propulsion Laboratory’s data-assimilating ocean bottom pressure (OBP) model. These are combined with three-dimensional surface velocities at 664 globally distributed sites. Although the durations of the surface geodetic time series are diverse, most of the data are collected by the global positioning system (GPS) technique during the 2000s and processed up to August 2007. Spherical harmonic coefficients of both PDMT and GIA signatures as well as other relevant parameters are then estimated from the data combination.
Here PDMT stands for present-day surface mass trend and GIA for glacial isostatic adjustment. Those interested in the theoretical framework - including the relevant measurement equations, data sets and uncertainty assessment - should look in the Methods section of the paper and the Supplementary Information pdf.
What is really interesting here is the resulting trend data for the change of bedrock height - the geoid height trend. The new method found that estimates used in the past were significantly in error. Antarctica was found to be rising, but not at as fast a rate as previously thought. Greenland, on the other hand, is actually sinking, particularly in the center of the ice sheet. Previous change estimates had Greenland rising everywhere.
“The negative GIA geoid trend in Greenland could be new evidence for additional net past ice accumulation (-100–300 m of ice depending on rheological properties and onset time) in comparison with the a priori model,”
the researchers state, noting that past accumulation over certain parts of Greenland has been suggested before by other models. The study results can be seen in the figure below, taken from the report.
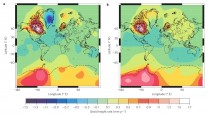
Unfiltered GIA geoid height trends.
In the figure a, shows rates estimated in the study, and b,those predicted by the ICE-5G/IJ05/VM2 model. While Wu et al. report that both Greenland and Antarctica are loosing ice-mass, they are doing so at a much lower rate than previous estimates and that both are gaining ice in their interiors. “The mass loss in Greenland is concentrated along the coastal areas, and is particularly heavy in the west, and in the southeast with the large Kangerdlugssuaq and Helheim glaciers,” they state. “In contrast, the interior of Greenland shows significant positive mass balance.”
Bottom line on the new work is that ice-mass loss has been overestimated by previous studies. “These findings confirm the ongoing shrinkage of the polar ice sheets,” state Bromwich and Nicolas. “However, and most importantly, the newly estimated ice-sheet mass losses represent less than half of other recent GRACE-based estimates for the same time interval: -230 +/- 33 Gt yr-1 for Greenland2 and -132 +/- 26 Gt yr-1 for West Antarctica.” According to Wu et al. “We conclude that a significant revision of the present estimates of glacial isostatic adjustments and land–ocean water exchange is required.” Perhaps this technique could be applied to the previous GRACE results for Himalayan glaciers as well.
So, when the more exact measurement separation methodology of Wu et al. is applied to the GRACE geoid data, ice sheet shrinkage, which has been systematically overestimated, is cut in half. “The differences between the work by Wu and colleagues and earlier studies may reflect errors in present deglaciation models with respect to the ice-load history and response of the Earth’s mantle,” conclude Bromwich and Nicolas. According to Wu et al.
“significant revision” is required. The general result - the Greenland and Antarctica ice sheets will be with us for a long time to come. See post here.
See Al Gore’s take on this based on the Liu and Curry 2010 model here that predicts future loss. See Bob Tisdale’s analysis here.
Selective MemoryBy Joseph D’Aleo, CCM
It has been, typical of La Nina summers after an El Nino winter, very warm in the east and central US. Some of our hottest summers have come in such years including most recently 1999, 1995, 1988, and 1977.
Here is the anomaly since June 1, 2010 (below, enlarged here).

Alarmists including Michael Mann, Joe Romm and Al Gore and their friends in the mainstream media have used the heat in the east and south and in parts of Russia along with the heavy rains in Pakistan as further proof of global warming. They conveniently ignore the concurrent record cold in coastal California, the record cold and snow in South America, Africa and Australia.
Last summer when the heat was notable by its absence for the second straight year in the UK and in the central US, it was proclaimed as the vagaries of weather and not climate and anyone who made a big deal of that was admonished that they did not understand the difference between the two.
Last July (2009) was in fact the coldest July on record (131 years) in parts of the Ohio Valley east to PA and nearly the coldest in the North Central states, the Tennessee Valley and Mid-Atlantic where the heat has focused this year (below, enlarged here).
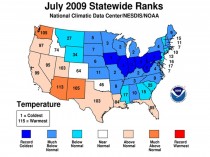
Then came the Northern Hemisphere winter. The winter was the coldest ever in parts of the south (dark blue areas) and well below normal in most of the south and central (below, enlarged here).
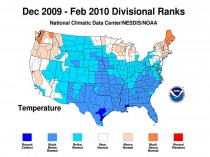
Heavy snow fell in many of the southern states east to the Mid-Atlantic. All time record seasonal snowfall occurred in the Mid-Atlantic (Washington, Baltimore, Philadelphia and Atlantic City). Record February snowfall fell in New York City. It was the second snowiest on record in Dallas and as far north as Des Moines, Iowa. We had the longest stretch of sub 80F temperatures in much of the south from Texas and Arkansas to the Carolinas to Florida and the longest stretch of sub 50F days on record in parts of Florida (link).
Extreme cold and heavy snows also fell across much of Eurasia. In parts of Russia it was the coldest ever. In most other locations the coldest since 1977/78. It was the coldest since 1962/63 in Scotland, since 1971/72 in North China (below, enlarged here).
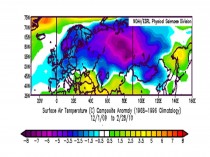
It had followed two straight winters when extreme cold and all time record snows fell in many parts of the northern United States and Southern Canada. And winters where snow, paralyzing in spots fell in unusual places worldwide including Iraq, Saudi Srabia, South Africa, Brazil, southern China (below, enlarged here).
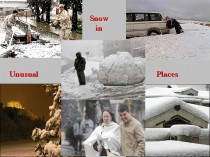
But that was weather we are told. In fact as we discussed here it was the result of a number of natural factors and a sign of things to come with respect to weather AND climate. Meantime, don’t be surprised to hear the media play the summer up big time this year, in sharp contrast to how they ignored the inconvenient weather in recent years. For example see this story although it achieves some balance with a reality check by meteorologists. See more on 2010 Perception vs Reality here and New Scientist’s story correctly blaming the extremes on an errant jet stream. The persistence of those wiggles in the jets tream may be solar related as we indicated in that story.
See PDF here.
-------------
Critical Details About Climate
by Kim Greenhouse on August 23, 2010
Joe D’Aleo joins us to discuss Surface Temperatures: A Policy Driven Deception, a new report that he co-wrote with Anthony Watts. Joe separates fact from fiction about CO2 and outlines its benefits and functions. Join us and learn how the EPA declared CO2 a toxin based on an analysis by a team with an agenda to control carbon and how we use energy and energy sources. Listen to this one hour interview here.
By Walter Cunningham, 8/24/2010
The subjects and style of my writing attracts rebuttals. I usually resist the temptation to respond, but the article by Robert Curl, Kenneth S. Pitzer-Schlumberger Professor of Natural Sciences Emeritus at Rice University and Nobel Prize Winner in Chemistry is just too good to resist. His article is typical of academics with all those advanced degrees, and who know what is best for the rest of us - if we would just listen. In typical global warming alarmist fashion, it attacks the credentials, the economic interests or the politics (or all three) of those who disagree with them, and does not cite any empirical data that would prove their critics do not know what they are talking about.
After citing the National Academy of Sciences endorsement of AGW, Professor Curl emphasizes the credentials of the members and claims the NAS is “objective.” Maybe we’re supposed to ignore bad science if the perpetrators’ credentials are good. NAS is certainly a prestigious organization, but, along with several other scientific organizations lately, it has descended into the world of science politics.
What about the 31,000 scientists who signed the Oregon Petition, saying they DO NOT think humans are making a noticeable contribution to global warming, global cooling, climate change or catastrophic climate change?
Professor Curl suggests that we “download a layman’s explanation… from the National Academy’s website at . . . to obtain the most authoritative information on the subject.” The site is quite representative of the alarmists’ approach to “explanation. Instead of attempting to make the case, it treats AGW as a given. They do offer the reader several articles on dealing with human caused global warning as a “fact of life” Professor Curl’s “authoritative” source leaves a lot to be desired unless you are already a true believer in AGW.
Curl goes on to say, “all of humanity is faced with some difficult choices. No matter what we do, from a major course correction to doing nothing, it will be unpleasant and expensive.” Doesn’t that amount to an admission that even if we meet and exceed the CO2 cuts targeted by the IPCC, our temperature will not return to normal - whatever that is?
Curl is right when he says that any actions to restrict CO2 will be “unpleasant and expensive.” A reduction in CO2 will have to come from a reduction in fossil fuel use. President Obama has talked about reducing U.S. fossil fuel use by 80 percent by 2050. That would leave our projected population in 1950 with a fossil fuel energy consumption of 40 million Btu/year-per-capita - about equal to our per capita consumption back in 1880. Given the direct relationship between energy consumption and standard of living, such a move would be worse than “unpleasant.”
He does admit, “These sobering conclusions about future warming are projections based upon elaborate models of the Earth.” These are models built to prove their hypothesis that human caused CO2 is a dominant factor in controlling the Earth’s temperature. Models are built on assumptions, not data; assumptions are (or, should be) based on interpretation of empirical data. It is in the biased interpretation of historical data where we should be having a public debate. Models are not data.
An American Meteorological Society survey in November 2009, found that a full 62 percent disagreed or strongly disagreed with “Global climate models are reliable in their predictions for a warming of the planet.” In the same survey, 50 percent of the respondents disagreed or strongly disagreed with the IPCC assertion, “Most of the warming since 1950 is very likely human-induced.”
The real crisis today is that so many people seem bent on making decisions based on, as yet, unproven scientific hypotheses that will cost all of us dearly - in standard of living, not just dollars. All of that in case the miniscule contribution humans make to the tiny amount of CO2 in the atmosphere could devastate the planet in the next 50-100 years.
When the concern is serious enough, the question should be researched objectively and publically. Those climate scientists who have not bought into the alarmists radical hypothesis deserve the same access to government grants as the fear mongers who have absorbed most of the $30 billion the government has expended to support AGW in the last 20 years.
We cannot always judge what a man says by his credentials. What he understands and can explain is most important. Look past the credentials and consider the logic of their case - if they try to make one. Better yet, look at the data yourself. That doesn’t mean models, which have not accurately predicted anything to do with climate.
What is wrong with laying out the data in a common setting so each advocate can understand why the other can’t see the light. We should be relying on the best objective data to draw scientific conclusions. How many times in the last decade have you seen a proponent of the new global warming hypothesis willing to publically debate a climate scientist supporting the historical theory of our global climate?
For those who do not feel comfortable assessing the empirical data themselves, I recommend a paper that looks at how the historical data is used or misinterpreted to conclude that temperatures during our lifetime are unusual and that humans are responsible for temperature change. PDF The paper is by Burt Rutan, the engineer behind Spaceship One and Spaceship Two. Like me, Burt is not a climate scientist and neither of us has an axe to grind on the question of AGW. Burt looks at each of the arguments the alarmists use to frighten us into believing that if we do not severely limit human CO2 emissions, they will devastate our planet by the end of the 21st century.
Show me the data. If it supports the claims of global warming alarmists, I will be glad to help alert the public. Unfortunately, the data I have been reviewing for the last 20 years provide no such support. See post here.

Walter Cunningham received a Bachelor of Arts degree with honors in Physics in 1960. He received a Master of Arts degree in Physics in 1961 from the University of California at Los Angeles. He was lunar module pilot on the first manned Apollo mission (Apollo 7)
By Dr. Anthony Lupo
Early in 2010, all signs pointed toward a warmer summer in the middle Mississippi region [1], and this would be related to the weakening El Nino [2],[3]. The forecast, however, did not go far enough because we did not anticipate how quickly La Nina conditions would take hold [4]. When asked about the possibility of a warm summer, I reminded people that the last few summers have been relatively cool, so even a normal summer may seem warm.
As the summer moves into late August, I have heard many in the media and in the local general public wonder aloud about this summer being the consequences of anthropogenic global warming, and that this summer has been the hottest in recent decades [5]. Putting this summer into context locally* would demonstrate that while it is the hottest summer of the decade, and the warmest since 1980, it is only the 11th warmest overall in 120 years. Of the ten warmest summers nine of them occurred before 1960. Summers as of late have been cooler in our region.
While the years 2005-2007 were warmer than normal, these summers did not rank in among the top 20 for our region. This current summer follows a stretch of summers that have been cooler overall as four of the last eight have been below normal, some of these by quite a bit. The summer of 2004 and 2009 ranked as the 3rd and 9th coolest overall in our region, respectively.
Adding to the woes of this summer locally have been the relatively high dew points brought on by excessive precipitation in our region in the early part of the summer. Additionally, it has not been the maximum temperatures that have been the problem (we have failed to reach 100 degrees for the third consecutive year), it has been the consistently high minimum temperatures. While it is too early to tell what has happened nationwide, my guess is the story is much the same in other regions as well.
Globally, we have heard about the heat in Russia and the Middle East, and flooding in Pakistan. While this may seem like it is a consequence of climate change, this summer season is not unlike another recent summer, that of 2003. That year, it was warm summer that followed the relatively cold winter of 2002-2003. That year, like this one followed a weak El Nino event.
This El Nino that was different from others in that main sea surface temperature anomaly was located over the central tropical Pacific rather than the over the eastern Tropical Pacific. We [2], [3] have found that these type of weak El Ninos could be associated with colder winters over the eastern USA rather than warmer winters which are routinely forecast to occur. Additionally, we have found that as El Nino transitions back toward La Nina, a warm summer over North America is generally the result [2][3].
In 2003, as a warm summer set in, a strong heat wave also occurred over western Europe and many in France perished. This year, we have seen a repeat of these type of conditions as the Northern Hemisphere has been relatively warm. The excessive heat became established over Russia instead during this summer due to a phenomenon called blocking [6]. Blocking causes large-scale weather patterns to stagnate, and if a ridge is established over a continent during the summer, it will be hot. We have seen this type of activity over Europe in 2003, Alaska in 2004 [7], and now Russia in 2010[8].
Is this really the hottest summer globally? While some have reported that it is [8], an examination of the global weather as a whole would suggest it is not [9]. Lost in much of the noise has been the fact that in the Southern Hemisphere, especially South America, conditions have been much colder during their winter with unprecedented snows in many areas not used to them. There is also some speculation that this summer’s global warmth has been exaggerated by those with an agenda.
So, while this summer has seemed to be miserable compared to the last few, it has been much worse in the past, is due to natural phenomenon (not anthropogenic climate change), and thankfully the heat should be winding down as August wears on and September comes in. Additionally, it is hoped that the Russian heat wave will draw more attention to the weather phenomenon of blocking that is difficult to forecast [6], [7] but largely overlooked.
*Here we used the Columbia, MO temperatures, which are representative of much of central Missouri. The story has been similar elsewhere across the state. These summer temperatures are only complete as of 1 June to August 18.
[2] Lupo, A.R., Kelsey, E.P., D.K. Weitlich, I.I. Mokhov, F.A. Akyuz, Guinan, P.E., J.E. Woolard, 2007: Interannual and interdecadal variability in the predominant Pacific Region SST anomaly patterns and their impact on a local climate. Atmosfera, 20, 171- 196
[3] Lupo, A.R., E. P. Kelsey, D.K. Weitlich, N.A. Davis, and P.S. Market, 2008: Using the Monthly classification of
global SSTs and 500 hPa height anomalies to predict temperature and precipitation regimes one to two seasons in advance for the mid-Mississippi region. Nat. Wea. Dig., 32:1, 11-33
[6] Wiedenmann, J.M., A.R. Lupo, I.I. Mokhov, and E. Tikhonova, 2002: The Climatology of Blocking Anticyc- lones for the Northern and Southern Hemisphere: Block Intensity as a Diagnostic. J. Clim., 15, 3459-3473.
[7] Hussain, A., and A.R. Lupo, 2010: Scale and stability analysis of blocking events from 2002 to 2004: A case study of an unusually persistent blocking event leading to a heat wave in the Gulf of Alaska during August 2004. Advances in Meteorology, in press.
See PDF.
--------------
The Great Russian Heat Wave of 2010
World Climate Report
The longer and deadlier the heat wave in western Russia becomes, the more frequently it is being linked to anthropogenic global warming.
But global warming theory doesn’t come anywhere close to explaining why it’s so darn hot this summer in Moscow.
Long-term observations suggest a more basic cause - an unusual and unprecedented (at least since 1950) confluence of several naturally-occurring atmospheric circulation patterns that together combined to set the stage for extreme warmth. Add to that urbanization, changing forestry practices, and perhaps throw in a dash of global warming for good measure, and you take a situation that would otherwise be “very hot” and up it a notch to “record hot.”
The driving force of the 2010 heat wave has been a stationary weather system that has remained locked in place over western Russia since mid-June. The atmospheric is termed to be “blocked” when atmospheric circulation patterns remained fixed in place, instead of being progressive. The prolonged snow and cold in the eastern half of the U.S. last winter was caused by an atmospheric block which locked in a pattern which allowed arctic air to slide southward and storm systems to track up the east coast. The heat in Russia is caused by a blocking pattern which has locked in high pressure over Moscow and environs which favors southerly (warm) flow, a lot of sunshine, and little rain.
Atmospheric blocking is not unique to today’s climate. It is associated with atmospheric teleconnection patterns, described the National Weather Services Climate Prediction Center (CPC) as “and persistent, large-scale patterns of pressure and circulation anomalies that span vast geographical areas.” The CPC ‘s description continues:
Teleconnection patterns are also referred to as preferred modes of low-frequency (or long time scale) variability. Although these patterns typically last for several weeks to several months, they can sometimes be prominent for several consecutive years, thus reflecting an important part of both the interannual and interdecadal variability of the atmospheric circulation.
All teleconnection patterns are a naturally occurring aspect of our chaotic atmospheric system, and can arise primarily a reflection of internal atmospheric dynamics.
Teleconnection patterns reflect large-scale changes in the atmospheric wave and jet stream patterns, and influence temperature, rainfall, storm tracks, and jet stream location/ intensity over vast areas. Thus, they are often the culprit responsible for abnormal weather patterns occurring simultaneously over seemingly vast distances.
The CPC identifies and monitors about 10 different teleconnection indices, each with specific patterns of atmospheric circulation and associated impacts on surface temperatures and precipitation. The CPC has compiled the history of these teleconnection indices back to January 1950 and up through the present.
Several of the teleconnection patterns impact temperatures in the vicinity of western Russia, these include teleconnections named “West Pacific Pattern” (WP), “Polar/Eurasia Pattern” (POL), and the “East Atlantic/Western Russia Pattern” (EA/WR).
Figure 1 shows the July pattern of surface temperature anomalies when each of these three teleconnections is in their positive mode. When the teleconnections are in their negative mode, the temperature anomaly patterns are reversed. Notice that all three have “hot spots” in an around western Russia. The value of the WP, POL, and EA/WR indices for July, respectively were -2.93, 1.7, and -1.55. This means that each of these teleconnections was in a configuration that leads to higher than normal temperatures in western Russia.

Figure 1. Pattern of temperature anomalies that is associated with the positive mode of three teleconnections influencing western Russia (figures from the Climate Prediction Center). Enlarged here.
Figure 2 shows the observed surface temperature anomalies for July, which include the big bull’s eye of high temperatures over western Russia - an expected result of the chance combination of the three teleconnection patterns.
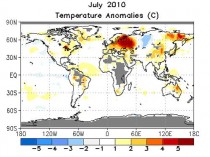
Figure 2. Surface temperature anomalies (C) for July, 2010 (figure from the Climate Prediction Center). Enlarged here.
Figure 3 shows the timeseries of the combination (sum) of the July values for the WP, POL, and EA/WR teleconnection indices (we first flipped the sign of the WP and EA/WR indices so that the combined index reflects the same sign of the temperature anomalies over western Russia).

Figure 3. Combined index of the WP, POL, and EA/WR telectonnection values for the month of July, 1950-2010 (data from the CDC). Enlarged here.
There are several things of note:
1) The July 2010 combined value is the highest since 1950 - nearly 50% greater than the second highest value which occurred in 1952.
2) The combined index has been mostly positive since 1981, and mostly negative from 1955 through 1980. This behavior imparts an overall positive trend since 1950.
3) The 2010 value is about 3 times greater than the value expected based on the trend alone.
Is anthropogenic global warming behind any of this behavior?
It is hard to know for sure, but one thing that is certain is that if global warming does have a hand in the game (perhaps through the trend term), what it’s holding is pretty weak.
Figure 4 is a map of temperature anomalies for July 1936 - another very hot month in western Russia. Notice how the general pattern of temperature anomalies looks a lot like those from July 2010 (in Figure 2). This would suggest that the combined teleconnection index for July 1936 was also quite high - we don’t know how high, because the compiled data from the CPC only goes back to 1950. But clearly, it can get hot in Moscow and western Russia without our help.
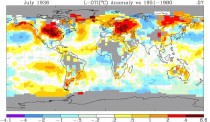
Figure 4. Surface temperature anomalies (C) for July, 1936 (figure from the Goddard Institute for Space Studies).
The lack of data on teleconnections prior to 1950 limits the historical setting within which we can place the 2010 event. Would the increasing trend exhibited in Figure 3 look the same if we had that included the known warm period of the 1930s? Just how high was the combined teleconnection index in July of 1936?
We don’t know. And lacking that knowledge, it is hard to ascertain what role other factors such as urbanization, smoke, or global warming may have had in making this summer a record summer in western Russia.
On its own, the summer of 2010 would have gone down in history as an extremely hot one in Moscow, with or without any influence from enhanced greenhouse gas concentrations.
Did our changes to the environment, locally, regionally, or globally add even a bit more to what nature had in store already?
Possibly? Probably?
The jury is still way out on this one.
See post on this one.
ICECAP NOTE: Recall this same area had one of the coldest (in places said to be the coldest) winter on record this past winter, again as the blocking pattern locked in, then with the ridge in the North Atlantic. Enlarged here.

But then we were told that was weather and the extremes were consistent with AGW.
Scientists can now study climate change in far more detail with powerful new computer software released by the National Center for Atmospheric Research (NCAR) in Boulder, CO. The Community Earth System Model (CESM) will be one of the primary climate models used for the next assessment by the Intergovernmental Panel on Climate Change (IPCC).
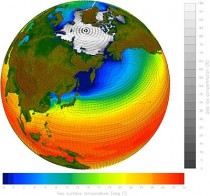
CESM is the latest in a series of NCAR-based global models developed over the last 30 years. The models are jointly supported by the U.S. Department of Energy (DOE) and the National Science Foundation (NSF), which is NCAR’s sponsor. Scientists and engineers at NCAR, DOE laboratories, and several universities developed the CESM.
“The Community Earth System Model is yet another step toward representing improved physics and biogeochemistry in a coupled model,” says Anjuli Bamzai, program director in NSF’s Division of Atmospheric and Geospace Sciences, which funds NCAR.
“As our understanding of climate-relevant processes improves, it is imperative to represent these processes in the model.”
The new model’s advanced capabilities will help scientists shed new light on some of the critical mysteries of global warming, including:
• What impact will warming temperatures have on the massive ice sheets in Greenland and Antarctica?
• How will patterns in the ocean and atmosphere affect regional climate in coming decades?
• What will be the likely interaction of climate change and tropical cyclones, including hurricanes?
• How will tiny airborne particles, known as aerosols, affect clouds and temperatures?
CESM is one of about a dozen climate models worldwide that can be used to simulate the many components of Earth’s climate system, including the oceans, atmosphere, sea ice, and land cover. The model and its predecessors are unique in that they were developed by a broad community of scientists. CESM is freely available to researchers worldwide.
“With the Community Earth System Model, we can pursue scientific questions that we could not address previously,” says NCAR scientist James Hurrell, chair of the scientific steering committee that developed the model. “Thanks to its improved physics and expanded biogeochemistry, it gives us a better representation of the real world.”
Climate scientists rely on computer models to better understand Earth’s climate system because they cannot conduct large-scale experiments on the atmosphere itself. Climate models, like weather models, rely on a three-dimensional mesh that reaches high into the atmosphere and into the oceans. At regularly spaced intervals, or grid points, the models use laws of physics to compute atmospheric and environmental variables, simulating the exchanges among gases, particles, and energy across the atmosphere.
Because climate models cover far longer periods than weather models, they cannot include as much detail. Thus, climate projections appear on regional to global scales rather than local scales. This approach enables researchers to simulate global climate over years, decades or millennia. To verify a model’s accuracy, scientists typically simulate past conditions and then compare the model results to actual observations.
The CESM builds on the Community Climate System Model, which NCAR scientists and collaborators have regularly updated since first developing it more than a decade ago. The new model enables scientists to gain a broader picture of Earth’s climate system by incorporating more influences.
Using the CESM, researchers now can simulate the interaction of marine ecosystems with greenhouse gases; the climatic influence of ozone, dust, and other atmospheric chemicals; the cycling of carbon through the atmosphere, oceans, and land surfaces; and the influence of greenhouse gases on the upper atmosphere. In addition, an entirely new representation of atmospheric processes in CESM will allow researchers to pursue a much wider variety of applications, including studies of air quality and biogeochemical feedback mechanisms.
Scientists have begun using both the CESM and the Community Climate System Model for an ambitious set of climate experiments to be featured in the next IPCC assessment reports, scheduled for release during 2013-14. Most of the simulations in support of that assessment are scheduled to be completed and publicly released beginning in late 2010, so that the broader research community can complete its analyses in time for inclusion in the assessment.
The new IPCC report will include information on regional climate change in coming decades. Using the CESM, Hurrell and other scientists hope to learn more about ocean-atmosphere patterns such as the North Atlantic Oscillation and the Pacific Decadal Oscillation, which affect sea surface temperatures as well as atmospheric conditions. Such knowledge, Hurrell says, can eventually lead to forecasts spanning several years of potential weather impacts, such as a particular region facing a high probability of drought, or another region likely facing several years of cold and wet conditions.
“Decision makers in diverse arenas need to know the extent to which the climate events they see are the product of natural variability and, hence, can be expected to reverse at some point, or are the result of potentially irreversible, human-influenced climate change. CESM will be a major tool to address such questions.”
Icecap Note: the model obviously has built in global warming - I thought the models were by nature supposed to be totally objective and let the chips fall as they may. They did not promise ability to predict important multi decadal ocean cycles, changes in the thermohaline circulations and no mention of improvements in use of solar factors. AR4 models virtually ignored solar changes and forcing. It sounds like the same old GHG, ozone chemistry, aerosol driven model with more land/sea interaction run at a higher resolution. Don’t expect any breakthrough findings or leap in skill.


